Tim Cook's 15 Years at Apple, by the Numbers
The Handoff
Apple announced on April 20, 2026, that Tim Cook will transition to Executive Chairman of the board of directors. John Ternus, the company's senior vice president of hardware engineering, will become chief executive officer on September 1, 2026.
Cook took over from Steve Jobs on August 24, 2011. The roughly 15-year span makes him one of the longest-serving CEOs in large-cap technology, and the longest in Apple's history. The legacy debate will run for years. The financial record, on the other hand, is already written in fiscal filings.
All figures below are sourced from Apple's 10-K filings and quarterly press releases covering fiscal 2011 through fiscal 2025.
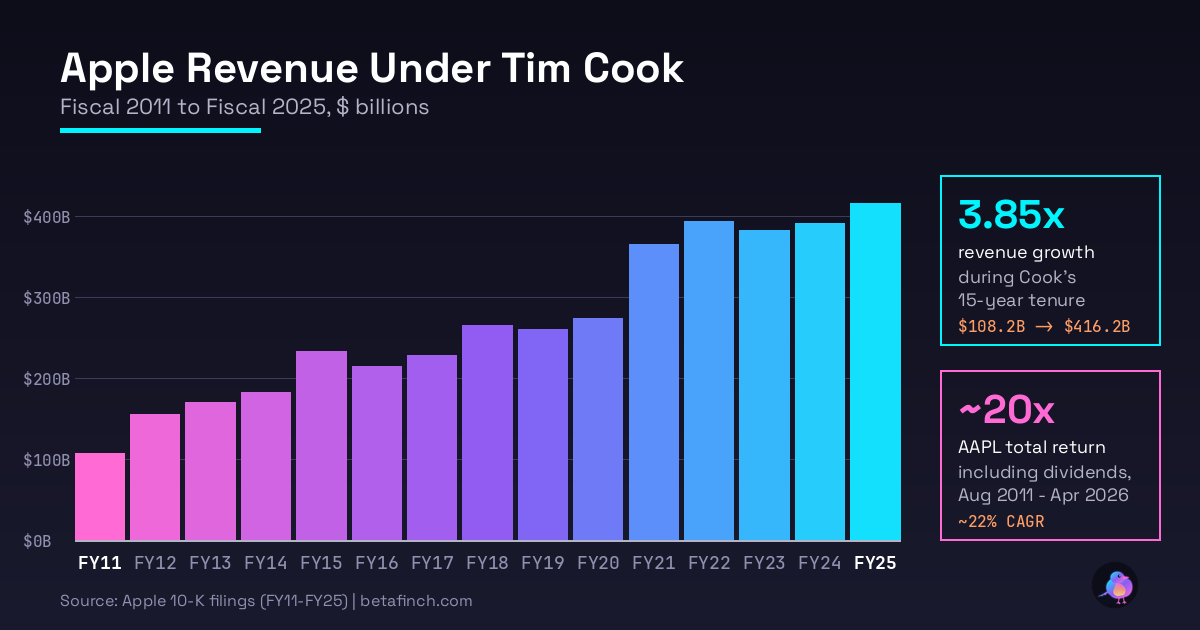
Revenue Nearly Quadrupled
Apple closed fiscal 2011 with $108.2 billion in revenue. The fiscal year ended September 24, 2011, one month after Cook became CEO. Fiscal 2025 closed on September 27, 2025, with $416.2 billion in revenue.
That is a 3.85 times increase, or a compound annual growth rate of roughly 10% per year over 14 fiscal years. For context, $416 billion exceeds the annual GDP of countries like Denmark, Austria, or Norway.
Key Numbers
Revenue: $108.2B
Net Income: $25.9B
Services: $9.4B
Market Cap: ~$350B
Revenue: $416.2B
Net Income: $112.0B
Services: $109.2B
Market Cap: ~$4.0T
iPhone Stayed Dominant. Services Did the Heavy Lifting.
The iPhone franchise nearly quintupled in dollar terms, moving from roughly $46 billion in fiscal 2011 to $209.6 billion in fiscal 2025. iPhone's share of total revenue rose slightly from 43% to 50.4%. Put differently, iPhone got bigger faster than Apple's other businesses.
The bigger structural shift happened in Services. The segment that includes App Store, iCloud, Apple Music, Apple TV+, AppleCare, licensing, and advertising generated $9.4 billion in fiscal 2011. Fiscal 2025 Services revenue reached $109.2 billion, an 11.7-fold increase.
Services also carries a gross margin above 74%, roughly double the product margin profile. That mix shift is one reason Apple's overall gross margin has expanded meaningfully from the 40.5% level reported in fiscal 2011.
New Hardware Categories Cook Launched
Cook inherited the iPhone, iPad, Mac, and iPod lineup. Under his watch, Apple added Apple Watch in 2015, AirPods in 2016, HomePod in 2018, and Vision Pro in 2024. Apple Silicon began replacing Intel chips in the Mac starting in late 2020.
None of these became iPhone-scale on their own. Collectively, however, the Wearables, Home, and Accessories segment Apple first broke out in fiscal 2015 now generates annual revenue in the high tens of billions of dollars, comparable to a Fortune 100 company in its own right.
Profits, Margins, and Cash Generation
Net income expanded from $25.9 billion in fiscal 2011 to $112.0 billion in fiscal 2025, a 4.3-fold increase. Diluted earnings per share grew at an even higher rate because of the sustained share-count reduction from buybacks, covered in the next section.
Operating cash flow crossed $100 billion in fiscal 2022 and has stayed above that level every year since. Apple's cash-generation engine now funds annual capital return programs larger than the net income of most Fortune 500 companies.
The $1 Trillion Capital Return Program
Apple did not pay a dividend when Cook took over. In March 2012, he announced the first quarterly dividend since 1995 alongside a share repurchase authorization. The board has expanded that program repeatedly every spring.
Since March 2012, Apple has repurchased more than $835 billion of its own stock and paid roughly $165 billion in dividends. Cumulative capital returns to shareholders under Cook cross the $1 trillion mark. No public company in history has returned more cash to shareholders in absolute dollars.
Fiscal 2024 saw $94.9 billion in buybacks. Fiscal 2025 added another $90.7 billion. The quarterly dividend, initiated at $0.378 per share (split-adjusted) in 2012, now exceeds $0.26 per quarter, with 13 consecutive annual raises.
The Stock
On August 24, 2011, the day Cook was appointed CEO, Apple closed near $13.44 per share on a split-adjusted basis, giving the company a market capitalization of roughly $350 billion. As Cook prepares to move to the chairman role in 2026, the stock trades near $273 and the market cap is approximately $4.0 trillion.
The share-price move works out to roughly a 1,930% increase over the 14.6 years Cook has been CEO. Including reinvested dividends, total return on AAPL during Cook's tenure sits near 20 times the starting investment, which translates to a compound annual return in the low 20s in percentage terms.
Over the same window, the S&P 500 total return was in the neighborhood of 460%, or roughly 12.5% compounded. AAPL outperformed the broad U.S. equity market by nearly two percentage points per year, every year, for 14 years running.
Geographic Footprint
In fiscal 2011, Apple's international revenue mix was already above 60% of the total, but Greater China was not yet a standalone reportable segment. Fiscal 2012 was the first full year China was broken out separately, and the segment has been the most discussed part of Apple's business ever since.
By fiscal 2025, Greater China generated $64.4 billion, roughly 15% of company revenue. The segment peaked at $74.2 billion in fiscal 2022 before trade tensions and local competition from Huawei, Xiaomi, and others pulled it lower. Americas revenue finished fiscal 2025 at $178.4 billion and Europe at $111.0 billion, both setting records.
What John Ternus Inherits
Ternus takes over a company generating more than $400 billion in annual revenue, a Services business on pace to cross $120 billion during fiscal 2026, and a balance sheet that still carries more than $60 billion in cash and marketable securities despite the massive capital return program.
Wall Street analysts covering the transition point to three open questions. How aggressive will Apple's generative AI strategy become. What is the next hardware cycle after iPhone. And can Services sustain double-digit growth from a $109 billion base.
Ternus joined Apple in 2001 and has overseen hardware engineering for every current product line, including Apple Silicon, the current iPhone generation, and Vision Pro. Continuity on the product side is considered high. The strategic questions, particularly around AI and Services, are where his imprint will show up first.
The Tenure in One List
- Revenue: $108.2B (FY11) to $416.2B (FY25), up 285%
- Net income: $25.9B (FY11) to $112.0B (FY25), up 332%
- Services revenue: $9.4B (FY11) to $109.2B (FY25), up 1,063%
- iPhone revenue: ~$46B (FY11) to $209.6B (FY25), up 356%
- Market capitalization: ~$350B (Aug 2011) to ~$4.0T (Apr 2026), up 11.4x
- Total capital returned to shareholders: $0 (before 2012) to more than $1T cumulative (2012 through fiscal 2025)
- AAPL total return during tenure: ~20x initial investment, vs ~5.6x for the S&P 500
Beta Finch covers every Apple earnings call in five languages. The most recent breakdown is the Q1 fiscal 2026 episode.